Fundamental Analysis:
On Thursday, February 20, 2025, the S&P 500 index dropped by 0.4%, mainly influenced by Walmart’s significant 6.5% decline. The retail giant provided a lower-than-expected revenue growth forecast, raising concerns within the sector and impacting competitors like Amazon and Target. Additionally, Epam Systems experienced the largest drop within the S&P 500, plummeting 12.8% due to weak earnings guidance, despite exceeding quarterly expectations.
Other significant declines included Axon Enterprises and Royal Caribbean Cruises, which were affected by potential new U.S. taxes on passenger vessels.
Meanwhile, Palantir Technologies saw its stock fall by 9.4% following rumours of U.S. defence budget cuts, a sector on which the company heavily relies. Defense Secretary Pete Hegseth announced an 8% annual Pentagon budget reduction over the next five years, combined with Palantir CEO Alex Karp selling $1.2 billion worth of shares, further unsettled investors.
Technical Analysis
US500, H3
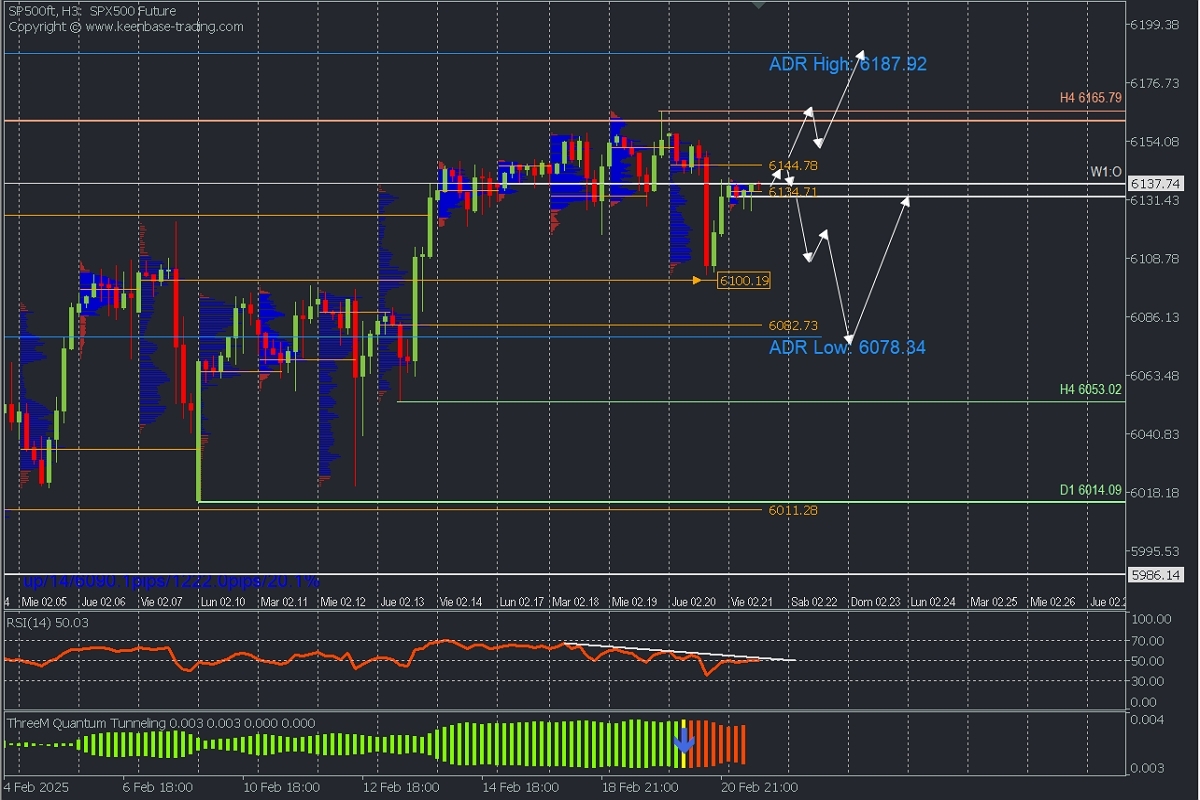
- Supply Zones (Sell): 6144.78
- Demand Zones (Buy): 6134.71 // 6082.73
Thursday’s sharp drop led to a retracement towards the last demand zone (broken supply zone) around 6100. A pullback towards yesterday’s uncovered POC at 6144.78 could encourage new selling entries, triggering another decline toward the next buy-side liquidity zone near 6082.73. This is also close to the daily average bearish range at 6078.34, potentially extending the correction.
The last validated intraday support is at 6053.02. As long as the current correction holds above this level, the technical structure will maintain a bullish bias. However, a decisive break above the supply zone at 6144.78 - 6155 would accelerate buying towards Wednesday’s all-time high at 6165.79 and extend towards the 6187 bullish average range.
Indicators:
- The RSI showed a bearish divergence on Tuesday and Wednesday, staying below 50, suggesting the continuation of the downward correction, especially if it remains below the divergence trendline.
- The Three M Quantum indicator also signals bearish momentum.
Technical Summary:
- Bullish Trend Continuation Scenario: Early buying opportunities may arise above the volume concentration and supply zone at 6145, with confirmed entries above 6155. Targets are set at resistances 6165, 6170, 6180, and 6187.
- Bearish Corrective Scenario: Sell positions could be considered below 6134, targeting 6100 and 6083, from where buying could resume.
Always wait for the formation and confirmation of an Exhaustion/Reversal Pattern (ERP) on the M5 timeframe, as demonstrated here, before entering trades at the key zones indicated.
Uncovered POC Explanation:
- POC (Point of Control): This is the price level or zone where the highest volume concentration occurred.
- If a downward movement followed it, the POC is considered a selling zone and forms resistance.
- Conversely, if an upward movement occurred from it, the POC acts as a buying zone, often located at lows, forming support areas.


